Climate
Köppen: Csb
Warm-summer Mediterranean
Temperate
Coldest month averages above 32°F (or 26.6°F).
Dry summer
Driest summer month under 1.6 in, and a third or less of the wettest winter month.
Warm summer
Every month averages under 71.6°F; at least four average above 50°F.
Does San Francisco qualify?
- Dry-summer climates like ours cover about 2% of Earth's land — Porto, Valparaíso and the Oregon coast share our code.
- One code covers the whole city. The sections below break it down.
Why It’s Cold
A cold current
The California Current runs south past us all year.
Upwelling
Northwest winds push surface water offshore; cold water rises to replace it. The ocean at Ocean Beach sits at 52–56°F in August.
The North Pacific High
Parked offshore from spring to fall. It blocks storms, and its sinking air lays a warm lid — the inversion — over the cool air below.
The Central Valley
95–105°F inland. Hot air rises, pressure falls, and marine air gets pulled through the gaps in the Coast Range.
- The sea-level gaps are the Golden Gate, the San Bruno Gap, the Petaluma Gap and Carquinez. They act as nozzles.
- Hotter Valley = harder push. The fog is strongest when inland California is at its worst.
- Winter turns it off: the High slides south, storms arrive, the lid breaks up. The clearest days of the year follow a January storm.
The Year
Average high and low, °F
Rain, inches a month
- September is the warmest month, October second. June is not summer here.
- Very little air conditioning in the housing stock, and not much heating either.
- 72°F in the Mission and 58°F with a 25 mph wind at Ocean Beach, same hour, same day.
Month-by-month table
| Month | High | Low | Rain |
|---|---|---|---|
| Jan | 57° | 46° | 4.4" |
| Feb | 61° | 48° | 4.4" |
| Mar | 62° | 49° | 3.2" |
| Apr | 63° | 50° | 1.5" |
| May | 64° | 52° | 0.6" |
| Jun | 67° | 53° | 0.2" |
| Jul | 67° | 55° | — |
| Aug | 68° | 56° | 0.1" |
| Sep | 70° | 56° | 0.2" |
| Oct | 69° | 54° | 1.1" |
| Nov | 63° | 50° | 2.6" |
| Dec | 58° | 47° | 4.5" |
Bay Micro
Around the Bay
The Bay Area’s eleven microclimates
- 1The Fog Coast 63°FFirst land the marine layer touches. Grey summers, green winters.Bodega Bay · Point Reyes · Pacifica · Half Moon Bay
- 2The City 67°FAll four fog zones in seven miles — see below.San Francisco
- 3The Bayshore 76°FMarine air softened by the crossing. The region's mildest strip.Berkeley · Oakland · San Mateo · Burlingame
- 4The Redwood Ridges 78°FThe Santa Cruz Mountains crest. Fog-catching redwoods, up to 45 inches of rain.Skyline · Kings Mountain · La Honda
- 5The Hills 80°FOverlooking Berkeley and Oakland, above much of the marine layer. Warmer, more sun, less fog.Berkeley & Oakland hills · 500–800 ft
- 6The Wind Tunnel 81°FA low break in the Coast Range. One of the windiest corridors in California.Petaluma · Sears Point
- 7Tam's Shadow 82°FMount Tamalpais blocks the direct marine push.San Rafael · Mill Valley · Novato
- 8The Sun Bowl 84°FFar from every gap and in the mountains' rain shadow. Driest and sunniest.Redwood City · Palo Alto · San Jose · Los Gatos
- 9The Delta Breeze 86°FWhere the Bay narrows into the Delta. Hot afternoons, then an evening breeze through the Carquinez Strait cools the whole inland valley.Benicia · Martinez · Pittsburg · Antioch
- 10Wine Country 88°FHot afternoons, fog-cooled nights — the swing that grows the grapes.Santa Rosa · Sonoma · Napa · CalistogaWine AVA map →
- 11Over the Hills 91°FEast of the Berkeley–Oakland hills: 90°F+ afternoons, cooled at night by the Delta breeze.Walnut Creek · Concord · Livermore · Fairfield
- 28°F separates Bodega Bay from Livermore on the same July afternoon, 80 miles apart.
- Skyline collects three times the rain San Jose does — storms are forced up and over the Santa Cruz Mountains.
- December afternoons barely vary — 52°F on Skyline to 59°F in San Jose. July is what sorts this region.
SF Micro
San Francisco Primary Microclimates
Fog
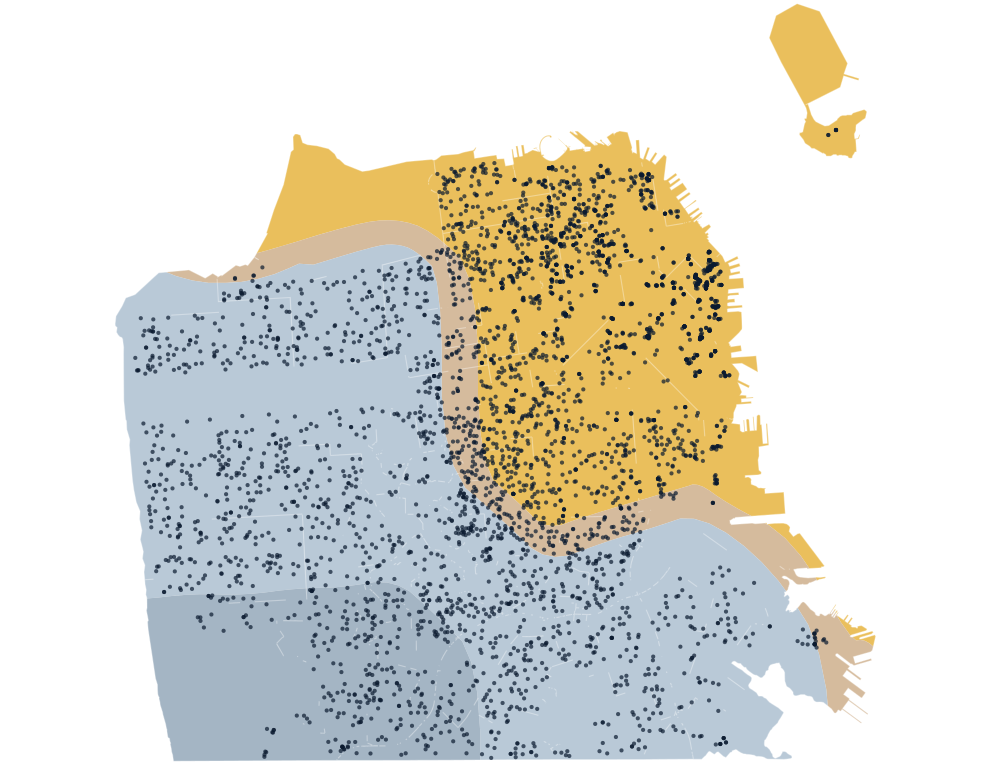 Open the Summer Fog Map →
A July day on the west side
What it is
- Air cooled to its dew point — the water it can no longer hold condenses.
- Ours is advection fog: humid ocean air crossing water colder than itself.
- Not tule fog — that forms on cold, still winter nights in the Central Valley.
Why summer
- Every driver peaks May to August: strongest High, coldest water, hottest Valley.
- Foggiest month: July.
- September and October relax the pattern — our warmest, clearest months.
How deep the fog is
The ridge
- Marine air comes in low and heavy and stacks against the western slope.
- It spills through the saddles and around the ends rather than over the top.
- Cole Valley sits below a saddle and gets the overflow. The Castro, a mile east, stays in the sun.
Two doors
- The Golden Gate feeds the northern half — Presidio, Richmond, Marina, across the Bay.
- The San Bruno Gap feeds the south along the 280 corridor.
- That second door is why Ingleside and Lakeshore see far more fog than the Mission a few miles north.
Inversion
- A strong cap stops the deck mixing out — it can sit all day.
- A weak cap lets the morning sun break it up.
- Offshore wind removes it: the fog goes out to sea and the city gets its 80°F days.
The Ridge
The ridge down the middle of the city — Mount Davidson 928 ft, Twin Peaks 922, Mount Sutro 909 — does to marine air what the Coast Range does to the region.
Sun
- The northeast quadrant, in the lee of the ridge.
- Eight to ten degrees warmer than the west side on a summer afternoon.
- Least wind, most reliable sun, highest price per foot.
North Beach, Russian Hill, Nob Hill, Telegraph Hill, Marina, Hayes Valley, Mission Dolores, South of Market
Transition
- The 8.5-hour line, where fog spills through the ridge's saddles — 22 neighborhoods reach it.
- Fog arrives in the late afternoon, gone by eleven the next morning.
- Sun on one block, grey on the next — 30 neighborhoods cover more than one zone.
Noe Valley, Eureka Valley, Lower Pacific Heights, Laurel Heights / Jordan Park, Bernal Heights, Potrero Hill, Haight Ashbury, Presidio Heights
Fog
- West of the ridge, plus the southern tier fed by the San Bruno Gap.
- Summer afternoons in the low 60s with a 20+ mph west wind.
- Grey mornings and evenings, with a clear spell around midday.
Inner Richmond, Outer Richmond, Inner Sunset, Outer Sunset, Cole Valley, Glen Park, West Portal, Excelsior
Persistent Fog
- The southwest corner — Ingleside, Oceanview, Parkmerced, Lakeshore.
- Runs to 12.5 hours a day, the most in the city.
- The city's most affordable houses.
St. Francis Wood, Westwood Park, Ingleside Terraces, Balboa Terrace, Merced Heights, Sunnyside, Outer Mission
Single-family median, 2026
Houses only, each counted by the fog zone at the house. Across all property types the order flips, because the Sun zone is mostly condos.
Block by Block
Wind
- 20–30 mph through the Golden Gate from midafternoon into the night.
- Ridgelines speed it up; the ground just downwind of a hill can be 10°F warmer and half as windy.
- Downtown towers throw their own gusts — a plaza can be unusable while the street behind it is calm.
Sun angle
- Low winter sun makes the direction a slope faces decisive.
- A north-facing slope can sit in its own shadow for weeks.
- A rear yard north of a three-story building may get no direct winter sun at all.
Elevation
- The fog deck has a top, usually 800–1,500 ft.
- Twin Peaks in sun above a white sea, Cole Valley 300 ft below it in grey — same afternoon.
- Higher is not automatically better: on a deep day the hilltops are first in and last out.
Grade
- Cold air is dense — at night it drains downhill and pools in the low ground.
- Glen Canyon and the Sunset's interior hollows run colder overnight than the slopes above them.
- A steep south-facing lot collects far more winter sun than flat ground next door.
Sun on the Lot
The lot from above
- In June the sun rises and sets behind the north wall — northeast and northwest.
- In December it rises and sets well south of east and west, and tops out at 29°.
- A north-facing rear yard spends most of the winter in its own house's shadow.
A 40 ft neighbor to the south, at noon
December noon sun on a 20% grade
Measure it yourself
- Sun Seeker or Sun Surveyor (phone): draws the sun's path over the camera view.
- Compass and inclinometer apps: the direction and angle to any roofline or tree.
- Google Earth: 3D buildings and a sun slider for any date.
- A photo from the yard at noon near December 21 settles it.
Sky chart — the whole sky, seen from the rear yard
Grey is the skyline: whatever the sun passes behind is lost sun. Dots mark 9am, noon and 3pm. An example lot — a phone sun app draws this for a real one.
What does your block get?
Send an address. I’ll send back its sun, wind, fog and sales.
Climate normals: NOAA/NWS, downtown San Francisco station. Fog hours: USGS analysis of GOES satellite imagery, 1999–2009. Regional figures are rounded. Diagrams are schematic. Any single year departs from all of it.